Why Should You Export and Analyze CSV Data from the Airthings Wave Plus?
For serious radon monitoring, the Airthings Wave Plus provides continuous tracking of radon levels, temperature, humidity, and air pressure. While the app offers daily, weekly, and monthly views, the true power lies in exporting the raw data as a CSV file. This export enables users to detect long-term trends, correlate radon spikes with weather events, and verify the effectiveness of mitigation systems. The data export feature is essential for homeowners tracking radon over months, as it provides granular detail that the app’s summary graphs cannot reveal.
How Do You Export CSV Files from the Airthings Wave Plus App?
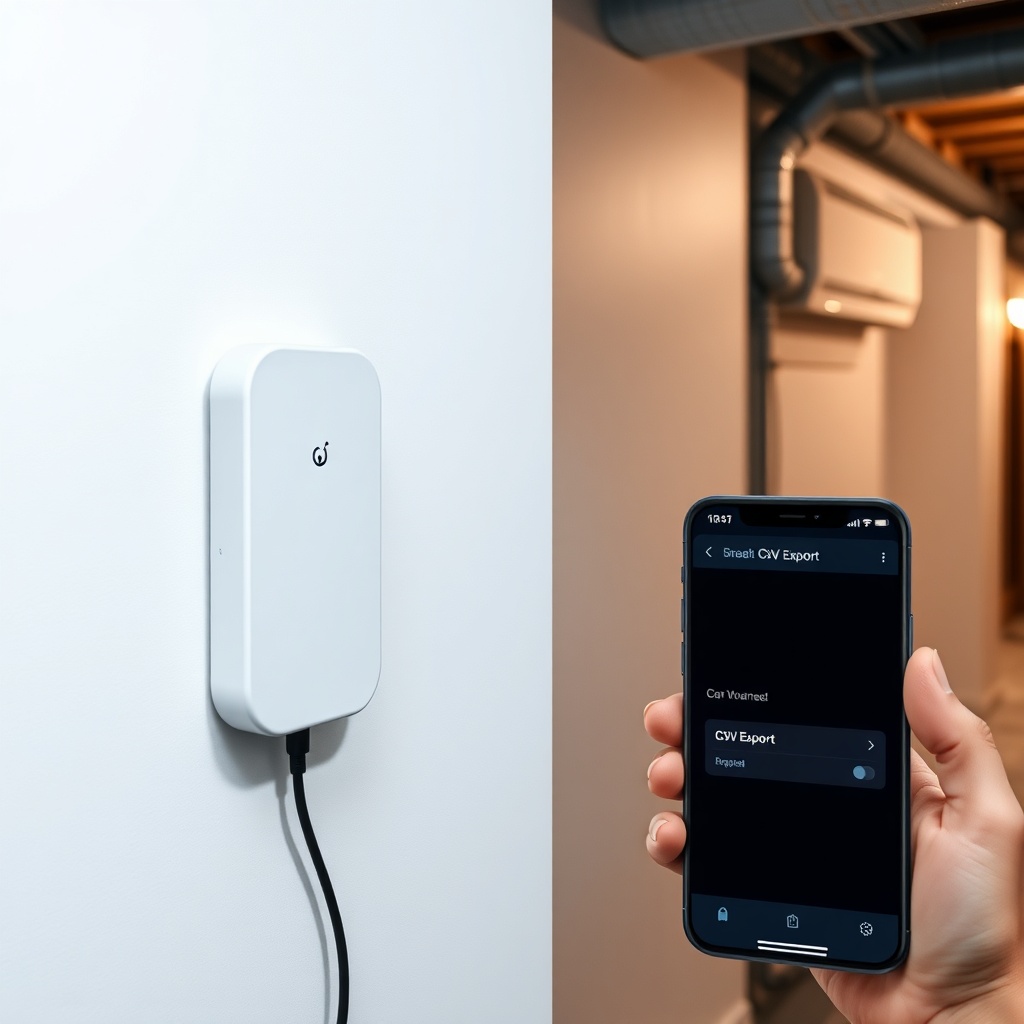
Exporting data is straightforward through the official Airthings app for iOS or Android. Navigate to the device dashboard, tap the settings icon (gear wheel), and select “Export data.” You can choose a date range—typically up to 90 days or the entire history since setup. The app generates a CSV file that you can email, save to cloud storage, or transfer to a computer. The CSV file contains columns for timestamp, radon concentration (in Bq/m³ or pCi/L), temperature, humidity, and air pressure.
What Key Columns and Data Points Are in the Exported CSV File?
Understanding the structure of your CSV file helps you extract meaningful insights. The typical format includes:
| Column Name | Example Value | Unit | Interpretation |
|---|---|---|---|
| Timestamp (UTC) | 2024-01-15 14:30:00 | UTC time | Measurement time in coordinated universal time. Convert to local time for daily patterns. |
| Radon | 4.2 | pCi/L | Radon concentration. Compare to EPA action level of 4.0 pCi/L. |
| Temperature | 68.5 | °F | Room temperature. Affects radon movement. |
| Humidity | 45.3 | % | Relative humidity. High levels may affect sensor accuracy (see our Airthings Wave Plus Placement for High Humidity Areas guide). |
| Air Pressure | 1013.2 | mbar | Barometric pressure. Low pressure often correlates with radon spikes. |
Radon values may be reported in Bq/m³. To convert to pCi/L, divide by 37. For example, 148 Bq/m³ = 4.0 pCi/L. The device samples every 10 minutes, but the CSV exports hourly averages for radon to reduce noise.
How Can You Identify Radon Trends Using Excel or Google Sheets?
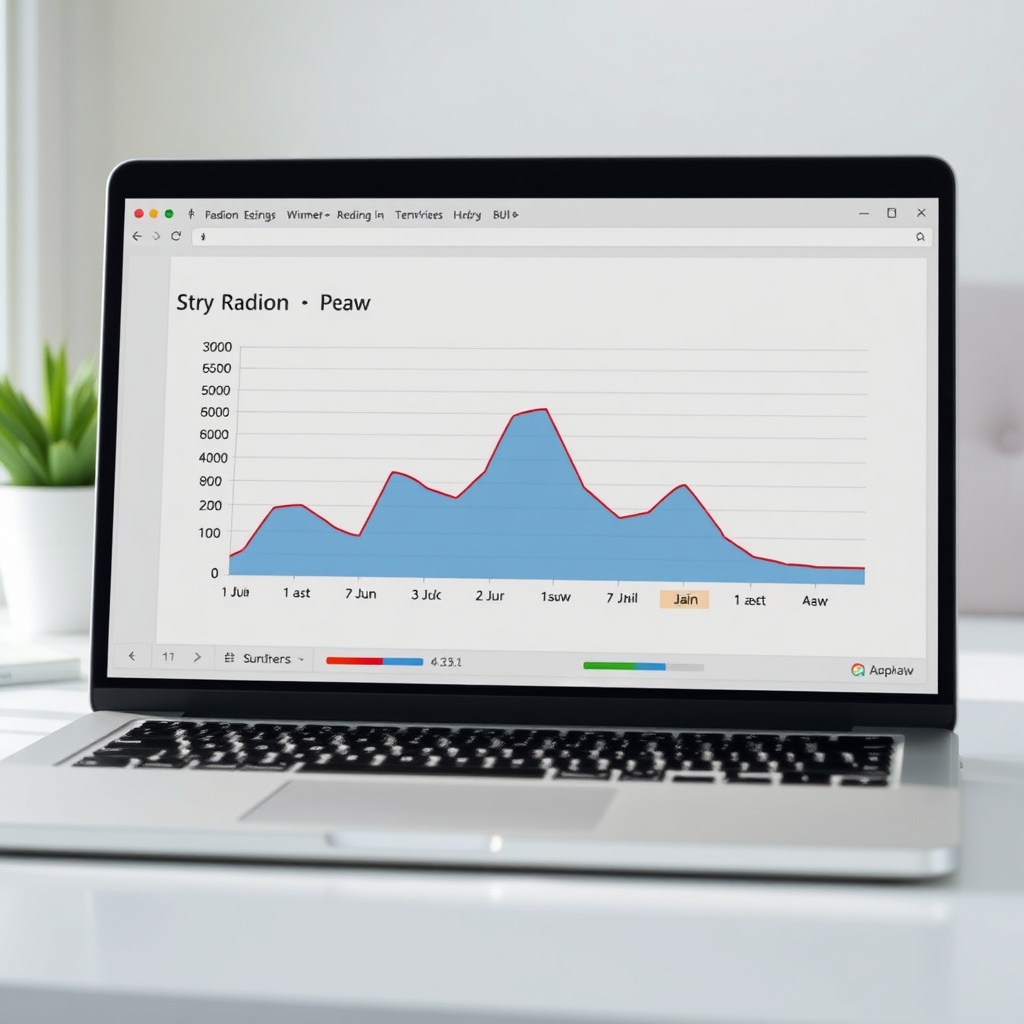
Once the CSV file is imported into spreadsheet software, you can apply filters and create pivot tables to spot patterns. Start by adding a column that converts UTC timestamps to your local time zone. Then create line charts with radon on the Y-axis and time on the X-axis. Look for daily cycles: radon often peaks in the early morning when the house is closed up, and dips during the day with ventilation. Also examine weekly trends—higher readings on weekends may indicate less mechanical ventilation. For a deeper dive, check our Airthings Wave Plus Radon Detector Fast Fluctuation Analysis to understand how quickly the sensor responds to changes.
What Do Long-Term Radon Trends Reveal About Your Mitigation System?
Exporting data over months allows you to assess the effectiveness of mitigation measures. If you installed a sub-slab depressurization system, compare the 3-month average before and after installation. A well-performing system should reduce radon levels by 50% or more. Also track seasonal trends: radon levels are typically higher in winter during heating months due to stack effect. The CSV export lets you calculate rolling averages and exceedance counts—how many days did radon exceed 4.0 pCi/L? For basements, proper Airthings Wave Plus Radon Detector Placement for Basements is crucial for accurate trend data.
How Do Environmental Factors Like Sunlight and Voice Alerts Affect Data Interpretation?
When analyzing trends, be aware of external influences. Our Airthings Wave Plus Light Sensitivity Test found that direct sunlight can slightly warm the device and affect humidity readings, but radon sensor remains stable. If your device is near a window, note that in your analysis notes. Also factor in the audible alarm: the Airthings Wave Plus Voice Alert Performance triggers at 4.0 pCi/L and can provide a wake-up call during high radon events. Correlate alarm logs with CSV data to see if alarms correspond to real spikes or false positives.
What Owners Say About Analyzing CSV Data from the Airthings Wave Plus
Homeowners who have used the CSV export feature report a mix of satisfaction and minor frustrations. One user in Colorado noted, “I exported six months of data and could clearly see that radon peaked every morning at 6 AM. My mitigation contractor used this data to adjust the fan schedule.” Another owner from Minnesota said, “The CSV export is great, but the timestamps are in UTC, which threw me off until I realized it. Converting to local time made my charts make sense.” A third user highlighted the precision: “I could see that after sealing cracks in my basement floor, the monthly average dropped from 5.2 to 2.8 pCi/L. The spreadsheet confirmed what the app summary hinted at.” The main complaint is that export is limited to 90-day chunks, though the device stores data indefinitely. Power users recommend logging exports quarterly to maintain a complete history.
Frequently Asked Questions
Can I export data from the Airthings Wave Plus without the app?
No. The official Airthings app is the only method to generate CSV files. You cannot connect directly to the device via USB. However, once exported, the CSV file is independent and can be opened on any computer.
What is the maximum date range for a single CSV export?
Up to 90 days at a time. For continuous monitoring, export every 2-3 months to ensure no data gaps. The device can store years of data on the cloud, but exports are chunked.
How often does the CSV file update with new data?
The app exports the latest available data at the moment of export. Radon readings are hourly averages derived from 10-minute samples. For real-time trends, use the app’s live view.
Can I use the CSV data to calculate annual average radon levels?
Yes. Export multiple CSV files covering 12 consecutive months, combine them in a spreadsheet, and calculate the arithmetic mean. This matches the EPA protocol for annual radon exposure assessment.
Does the CSV file include battery level or error codes?
No. The export includes radon, temperature, humidity, and air pressure only. Battery status and sensor errors appear in the app dashboard but are not exported. Check the app for device health.
How do I compare CSV data from multiple Airthings Wave Plus units?
Export each unit separately. Ensure timestamps align (convert to same time zone). Use a common column structure and concatenate rows. Label each data set with the device location (e.g., basement vs. living room) for cross-comparison.