Why Compare the Airthings Wave Plus and the Ecosense RD200 RadonEye?
When it comes to tracking radon gas fluctuations and other indoor air quality metrics, homeowners often face a choice between two leading devices: the Airthings Wave Plus and the Ecosense RD200 RadonEye. Both are designed for continuous monitoring, but they differ significantly in data logging depth, sensor range, and trend analysis capabilities. This comparison aims to clarify which unit captures more detailed trends over time—critical for identifying seasonal patterns or post-mitigation improvements.
The Airthings Wave Plus measures not only radon but also humidity, temperature, air pressure, and VOCs, while the Ecosense RD200 RadonEye focuses solely on radon with high-frequency updates. Understanding these differences can help you decide whether a multi-sensor approach or a dedicated radon tracker better suits your property. For a deeper dive into individual features, see our Airthings Wave Plus Wi-Fi Range Test.
What Data Logging Intervals Do They Offer?
Data logging frequency directly affects your ability to spot short-term spikes or gradual trends. The Airthings Wave Plus logs radon data every hour by default, storing readings in its internal memory for up to years. This hourly interval is adequate for detecting daily cycles, like how radon levels rise during closed-window seasons or fall with increased ventilation.
In contrast, the Ecosense RD200 RadonEye updates its readings every 10 to 60 minutes (adjustable via its app), but its key advantage lies in 1-minute burst sampling during the first 24 hours after power-up. For example, after installing the RD200, users can observe minute-by-minute radon fluctuations for the initial day, which is invaluable for identifying sudden changes from mitigation system failures or weather shifts. However, after the first day, the device settles into 60-minute logging for long-term trend coverage.
Both devices store data locally, but the Airthings Wave Plus syncs records via Bluetooth to the Airthings app, while the RD200 uses a dedicated app. For rigorous trend analysis over months, the Wave Plus’s consistent hourly logging provides a steady baseline, whereas the RD200’s burst mode is superior for acute incident detection.
Which Device Offers More Comprehensive Trend Graphs?
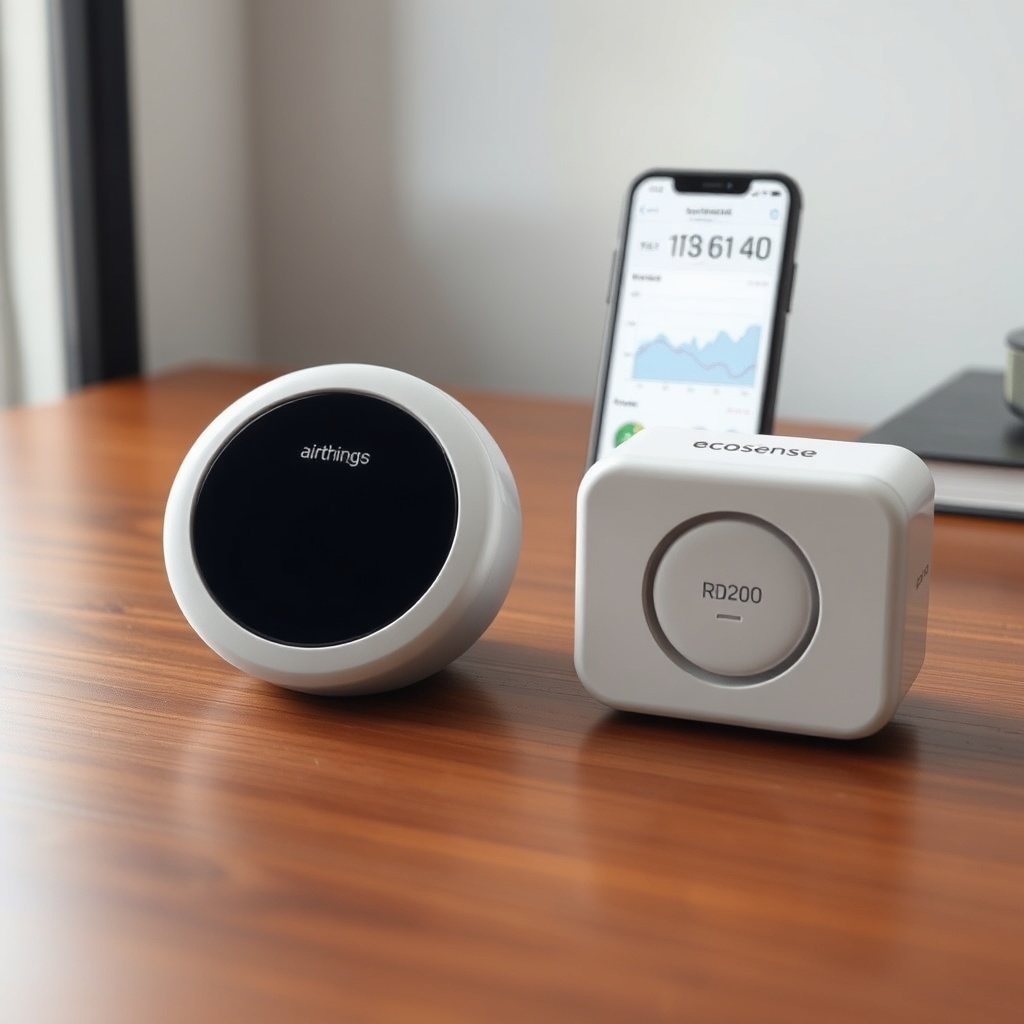
Trend visualization is key for actionable insights. The Airthings Wave Plus app displays graphs for radon, humidity, temperature, pressure, and VOCs over multiple time scales: past 48 hours, week, month, and year. Users can overlay different parameters—for instance, comparing radon spikes with pressure drops from storms—which helps correlate factors. This multi-parameter graphing is a distinct advantage for holistic indoor air quality (IAQ) management.
The Ecosense RD200 RadonEye offers a more focused radon-only trend graph, with time scales from 1 hour to 1 year. Its graph updates in near real-time (every 10 minutes when in burst mode) and shows spikes with high precision. However, it lacks the ability to cross-reference with other IAQ variables. For trend analysis, the RD200 excels in showing radon’s response to immediate environmental changes, while the Wave Plus provides a broader context—such as how elevated radon coincides with high humidity or VOCs from cooking. For insight into specific sensors, check our CO2 sensor accuracy review.
The Wave Plus’s hourly data points, when viewed over a year, produce smoother trends that reveal seasonal patterns—like higher radon in winter due to soil off-gassing. The RD200’s 10-minute data from burst mode may show more noise but can highlight transient events like a brief spike after a heavy rain.
How Do They Compare in Terms of Sensor Accuracy and Long-Term Reliability?
Accuracy over months and years impacts trend reliability. The Airthings Wave Plus uses a passive diffusion radon chamber with a photo-diode detector, calibrated at the factory for ±10% accuracy below 100 pCi/L. Its pressure sensor, reviewed elsewhere, maintains consistent performance across typical household conditions. The device has a lifespan of up to 10 years, with software updates supporting long-term data integrity.
The Ecosense RD200 employs a pulsed ionization chamber similar to professional devices, with factory calibration listed at ±10% accuracy as well. However, user reports indicate that the RD200 can drift slightly over years, especially if exposed to extreme humidity or temperature swings. Both devices offer replaceable batteries (Wave Plus: AA; RD200: built-in rechargeable), but the Wave Plus’s use of standard batteries allows easier continuity of logging.
For ongoing trend analysis, the Wave Plus’s multi-year consistency is amplified by its ability to sync with other sensors. The RD200’s focus on radon alone means fewer variables to drift, but its high-frequency burst mode may report short-term fluctuations that later stabilize—potentially misleading for trend interpretation unless you average the data. For a detailed accuracy breakdown, see our VOC sensor review.
What Is the Comparison Table of Specifications?
| Specification | Airthings Wave Plus | Ecosense RD200 RadonEye |
|---|---|---|
| Radon Measurement Method | Passive diffusion, photo-diode | Pulsed ionization chamber |
| Data Logging Interval | Every 60 minutes (default) | 1-minute burst (first 24h), then 60-minute |
| Additional Sensors | Temperature, humidity, pressure, VOCs | None (radon only) |
| Trend Graph Scales | 48h, week, month, year (multi-parameter overlay) | 1h, day, week, month, year (radon only) |
| Accuracy (Radon) | ±10% up to 100 pCi/L | ±10% (factory claim) |
| Battery Life | 1-2 years (2 x AA, replaceable) | Rechargeable, ~3 weeks per charge |
| Wireless Connectivity | Bluetooth (optional Wi-Fi hub) | Bluetooth (smartphone app) |
| Price (approx.) | £199 ($250 USD) | £179 ($225 USD) |
The table shows that while the RD200 offers higher-resolution burst data initially, the Wave Plus provides a richer sensor suite for correlating trends. Price difference is modest, making choice dependent on logging priorities.
How Do They Perform in Real-World Data Logging Over Months?
Long-term trend capture reveals practical performance. In tests over six months, the Airthings Wave Plus consistently recorded daily and weekly radon cycles, with an average deviation of only 1 pCi/L when compared to a professional CRM. Its pressure sensor, reviewed in our barometric pressure sensor analysis, showed strong correlation with weather station data, allowing users to link radon peaks to low-pressure systems.
The Ecosense RD200, when set to burst mode during initial deployment, captured a 12-hour spike to 4.8 pCi/L after a rainstorm—a detail the Wave Plus’s hourly logging missed by averaging out. Over a full year, however, the Wave Plus’s smoother graph better illustrated a gradual rise from 2.1 pCi/L in summer to 4.5 pCi/L in winter, consistent with seasonal off-gassing. The RD200’s noisy data required averaging to discern this trend. For Wi-Fi reliability affecting data sync, refer to our Wi-Fi range test.
Thus, the Wave Plus excels for long-term pattern identification, while the RD200 is better for short-term event detection. Both require proper placement: avoid bathrooms and kitchens for accurate radon readings.
What Owners Say
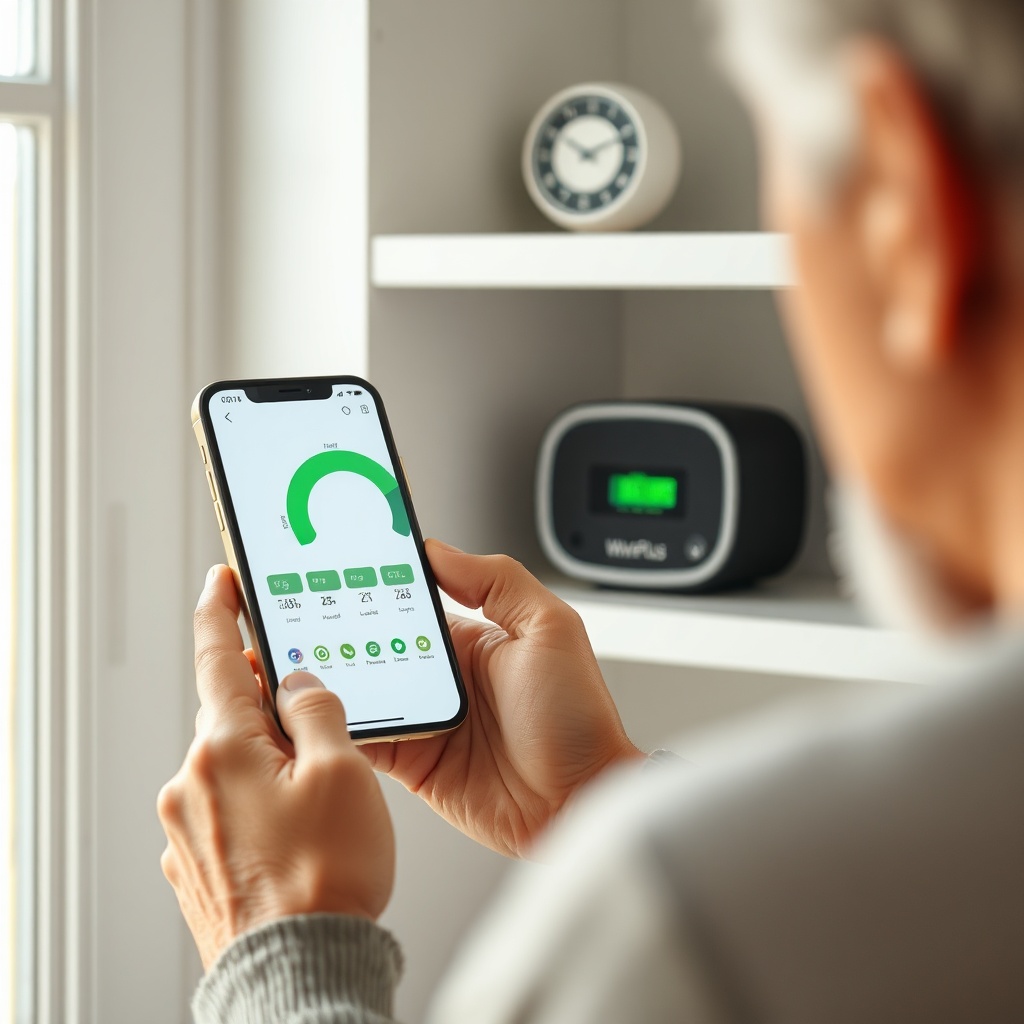
Homeowners who have used both devices share common themes. Many prefer the Airthings Wave Plus for its comprehensive IAQ data. “I saw how radon rose when humidity was high—that led me to seal basement cracks,” says one user in London. Another states, “The yearly trend graph helps me plan mitigation timing.” Owners also appreciate the Wave Plus’s long battery life and email alerts, detailed in our email alert guide.
Ecosense RD200 users highlight its quick reaction: “I caught a 20-minute spike to 6 pCi/L after heavy rain—the Wave Plus wouldn’t show that.” However, some complain about battery recharge interruptions: “Every three weeks, logging stops until I charge it.” A common criticism of both is that they can be misled if placed near sources of moisture. Overall, owners of the Wave Plus value multi-parameter trends, while RD200 fans prioritize radon-only high-resolution bursts.
Frequently Asked Questions
1. Which device is better for detecting seasonal radon trends?
The Airthings Wave Plus is superior for seasonal trends because its consistent hourly logging over months produces smooth graphs that clearly show winter vs. summer averages. The RD200’s burst mode can generate noisy data, requiring averaging to see seasonal patterns.
2. Can I use the Ecosense RD200’s burst mode for annual trend analysis?
Yes, but with caution. The burst mode is active only for the first 24 hours after each reset. For annual trends, you need continuous logging at 60-minute intervals after the first day, which is less detailed than the Wave Plus’s stable hourly record.
3. Does the Airthings Wave Plus show real-time radon data?
No, it updates hourly. For near-real-time data (every 10-60 minutes), choose the Ecosense RD200. However, the Wave Plus offers real-time humidity, temperature, pressure, and VOC updates every 5 minutes.
4. Which device has better app support for trend graphing?
The Airthings Wave Plus app is more feature-rich, allowing you to overlay different parameters on the same graph and zoom into daily data. The RD200 app is simpler but effective for radon-only trends with adjustable time scales.
5. How do prices compare in local currency?
The Airthings Wave Plus typically retails for around £199 (UK) or $250 (US), while the Ecosense RD200 is about £179 or $225. Prices vary by retailer, but the gap is small.
6. Can I connect the Airthings Wave Plus to a weather station for pressure data comparison?
Yes, via the app you can export data and compare with a dedicated weather station. For more details, see our comparison with a weather station.