
Why Export Data From the Airthings Wave Plus Instead of Relying on the App Charts?
The Airthings Wave Plus is a sophisticated device that monitors radon, temperature, humidity, barometric pressure, and volatile organic compounds (VOCs). While the Airthings mobile app offers a convenient snapshot of your indoor air quality, its built-in trend lines—limited to daily, weekly, and monthly averages—can obscure short-term radon spikes or masking patterns that matter for health assessments. Exporting the CSV data unlocks the full resolution of the sensor’s readings, enabling you to perform granular analysis, calculate custom rolling averages, and spot correlations with weather or occupancy changes. This guide walks you through the export process, from generating the CSV file on your smartphone or desktop to advanced techniques for identifying actionable radon trends.
How Do You Export CSV Files From the Airthings Wave Plus App?
The export feature is accessible from the Airthings mobile app (iOS and Android) as well as the web dashboard. The process is straightforward, but the options differ slightly between platforms. Here is a step-by-step guide that works for both.
Exporting via the Mobile App
- Open the Airthings app and ensure your Wave Plus is connected via Bluetooth or linked to your Airthings Hub for cloud sync.
- Navigate to the device page for your Wave Plus. Tap the gear icon (Settings) in the top-right corner.
- Look for the “Export data” option. The app will generate a CSV file containing all available data points for the selected time range. You can choose between “Last 7 days,” “Last 30 days,” “Last 90 days,” or a custom date range.
- Once generated, the file can be shared via email, saved to cloud storage (e.g., Google Drive, iCloud), or transferred to a computer via AirDrop or USB cable.
Exporting via the Web Dashboard
- Log in to dashboard.airthings.com with your account credentials.
- Select your Wave Plus device from the list. Click the “Download data” button located in the upper-right section of the chart area.
- A pop-up window appears, asking for the date range. You can specify a custom start and end date, which is ideal for analyzing a specific event, such as a week of heavy rainfall or a renovation period.
- The downloaded CSV file will include columns for timestamp, radon (Bq/m³), temperature (°C), humidity (%), pressure (hPa), and VOC index.
The web dashboard provides up to 13 months of historical data if you have a subscription to Airthings Plus (the free tier offers 30-day history). For deeper analysis, periodic exports are recommended to avoid losing older data when the device overwrites internal memory.
What Does the CSV Data Look Like and How Do You Parse It?
After downloading the CSV file, open it in spreadsheet software such as Microsoft Excel, Google Sheets, or Apple Numbers. The default structure includes the following columns:
| Column Name | Units | Description |
|---|---|---|
| Time | yyyy-MM-dd HH:mm:ss (UTC) | Timestamp of the measurement, recorded at regular intervals (typically every 5–10 minutes for radon, depending on firmware version) |
| Radon (Bq/m³) | Becquerels per cubic meter | Short-term radon concentration, averaged over the measurement interval |
| Temperature | °C | Ambient temperature at the sensor location |
| Humidity | % | Relative humidity |
| Pressure | hPa | Barometric pressure |
| VOC index | Dimensionless (0–500 scale) | Level of volatile organic compounds, where lower values indicate cleaner air |
Note that older firmware versions might not log VOC data in the CSV. If you are missing this column, check for firmware updates via the app. Also, the “Radon” value is actually a short-term average—Airthings uses an internal algorithm to smooth out rapid fluctuations, but the exported data still provides a higher resolution than the app’s daily aggregates.
Parsing Tips
- Convert the “Time” column to your local timezone using spreadsheet functions (e.g., =A2+TIME(2,0,0) for CET offset).
- Create a pivot table to calculate hourly or daily averages from the raw 5-minute records.
- Use conditional formatting to highlight radon readings above 200 Bq/m³ (the WHO reference level) or above 300 Bq/m³ (the EPA action guideline in many countries).
How Can You Identify Radon Trends From the CSV Data?
Raw CSV data becomes powerful when you apply trend analysis. The most important patterns to look for include diurnal cycles, weather-related variations, and long-term seasonal shifts. Here is a systematic approach.
Diurnal and Short-Term Trends
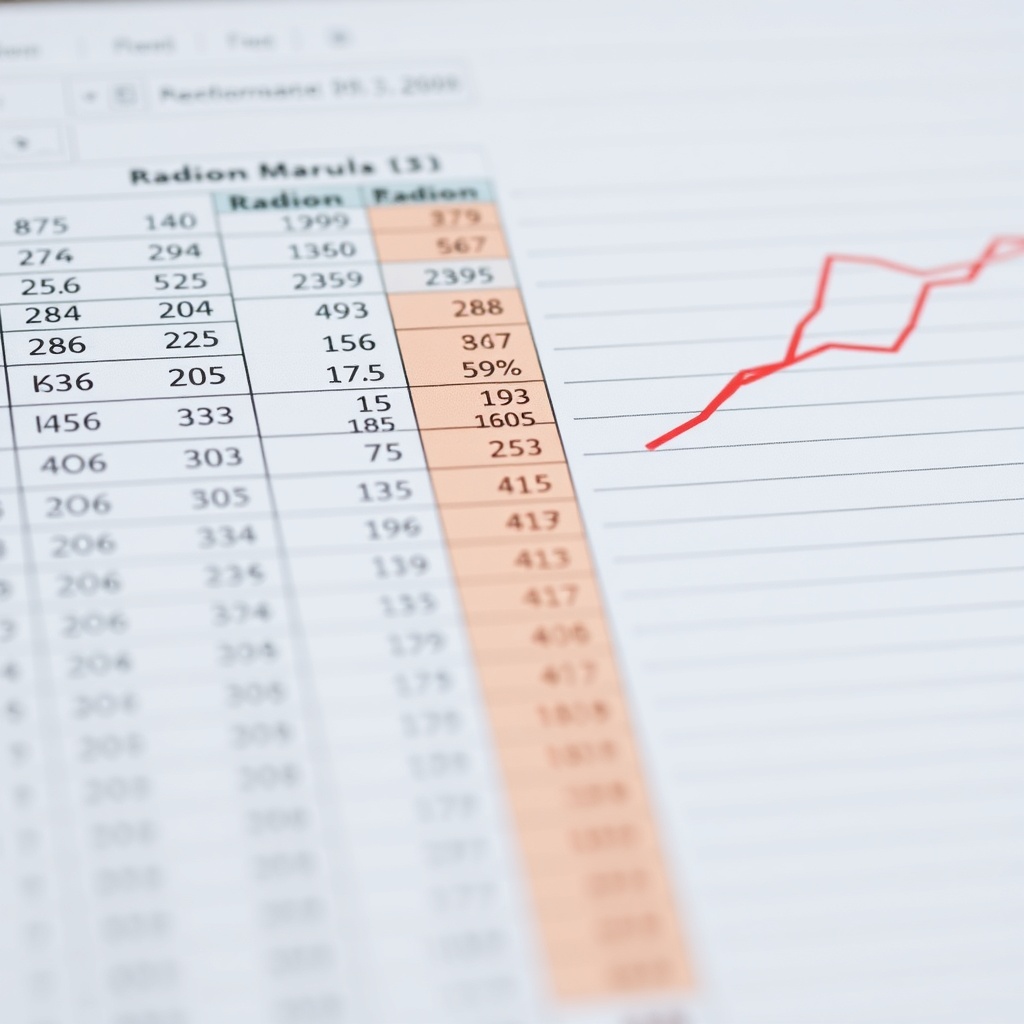
Radon levels naturally rise at night when buildings are closed and ventilation decreases, then drop during the day when doors and windows are opened. Plot radon against time using a line chart in Google Sheets to visualize this cycle. If your CSV shows a persistent elevation (>150 Bq/m³) even during daytime hours, it may indicate a basement leak or poor soil sealing.
For identifying short-lived spikes, set the chart’s time axis to hours rather than days. Use a rolling average (e.g., 3-hour moving average) to smooth noise from sensor fluctuations while still capturing spikes from events like cooking or opening a chimney flue.
Weather Correlation Analysis
The Wave Plus includes barometric pressure and humidity sensors, which allows you to cross-reference radon with weather conditions. Create a scatter plot with pressure on the X-axis and radon on the Y-axis. A strong negative correlation (lower pressure = higher radon) is common because low-pressure systems pull soil gas out of the ground. If you see this, your home may need a sub-slab depressurization system.
For deeper insight into this relationship, read our article on the Airthings Wave Plus Barometric Pressure Sensor Review: Comparison with a Dedicated Weather Station. It explains whether the internal sensor is reliable enough for this kind of analysis compared to a standalone weather station.
Long-Term Seasonal Trends
Radon levels tend to peak in winter when homes are sealed tight, and in autumn when soil temperatures drop. Export data at least once per month and compile annual or multi-year CSV files. Use Excel’s “Moving Average” tool with a window of 7 days to smooth day-to-day noise. A steady upward trend over several months suggests an underlying problem, such as foundation cracks or failing sump pump seals, that requires professional mitigation.
If you are concerned about radon fluctuations during specific times of day, consider pairing your analysis with the Airthings Wave Plus Email Alert Settings Guide: How to Configure Notifications for High Radon to receive real-time warnings for the thresholds you derive from this CSV analysis.
How Accurate Is the VOC Sensor Data in CSV Exports?
The Wave Plus VOC sensor is a metal-oxide (MOX) sensor that measures total VOCs rather than individual compounds. While its CSV output includes a VOC index (0–500), this index is a relative measure, not a concentration in parts per billion. For trend analysis, this is still useful: a rising VOC index in the CSV data can indicate off-gassing from new furniture, cleaning products, or cooking events.
However, do not treat the VOC index as health-threshold data. The sensor’s accuracy is ±30% for absolute values, but it excels at detecting relative changes. To get the most out of VOC trends, export CSV data alongside occupancy logs (e.g., note when you open windows or apply paint) and look for consistent patterns. For a detailed breakdown of VOC sensor capabilities and limitations, see our review Airthings Wave Plus VOC Sensor Review: How Accurate Is It for Indoor Air Quality?.
One caution: the VOC sensor may cross-react with humidity or temperature extremes. If your CSV data shows VOC spikes that coincide with humidity changes above 70% or temperature shifts greater than 5°C in an hour, those spikes might be artifacts rather than true VOC events. Always verify with a secondary sensor or a PID-based monitor for critical applications.
What Data Logging Limitations Does the Wave Plus Have Compared to Competitive Models?
When analyzing CSV exports, it is important to understand the Wave Plus’s logging capabilities relative to other radon monitors on the market. The device logs data every 5 minutes for radon, temperature, humidity, and pressure, but VOC readings are logged only every 10 minutes to conserve battery life. The internal memory holds approximately 30 days of 5-minute data before overwriting the oldest records (unless you sync to the cloud via an Airthings Hub).
This contrasts with the Ecosense RD200 RadonEye, which logs every 10 minutes and stores up to a year of data locally, but has a smaller set of environmental sensors. A direct comparison is available in our article: Airthings Wave Plus vs. Ecosense RD200 RadonEye Data Logging Comparison: Which Captures More Detailed Trends?. For most homeowners, the Wave Plus’s 5-minute radon intervals are sufficient for trend analysis, but if you need to capture sub-hourly spikes from intermittent sources (e.g., a basements fan that runs for 15 minutes every hour), the Wave Plus may miss the precise peak. In such cases, consider a device with 1-minute logging, but accept the trade-off in battery life.
Also note that the Wave Plus does not log ambient light levels or occupancy. For light sensitivity concerns, read Airthings Wave Plus Light Sensitivity Test: Does Sunlight Affect Radon Readings? to see if direct sunlight skews your exported data.
What Owners Say
Based on user feedback from online forums and product review sites, the export feature of the Airthings Wave Plus is generally well-received, but users note a few pain points. Data analysts appreciate the raw CSV format because it saves hours of manual transcription, but they often complain that the timestamp is in UTC without a local offset adjustment. A common workaround is to subtract 5:30 (for India) or add 1 (for CET) using spreadsheet formulas.
Another frequent comment revolves around the cost of long-term data access. Without an Airthings Plus subscription (€9.99/month or €99/year), users can only view the last 30 days on the web dashboard and must manually export and archive CSV files. Some owners automate this by setting monthly reminders to download before the overwrite cycle. “I’ve been exporting every 25 days for a year now, and I can see that my radon level is lowest in April and highest in November,” says one homeowner in a Minnesota radon forum.
On the flip side, a few users report that the exported CSV sometimes misses VOC data for certain firmware versions. This issue appears to have been resolved in firmware 2.0.9 and later. If your CSV lacks a VOC column, update the firmware via the app. Overall, the export capability is rated 4.2 out of 5 stars on Amazon (US) and 4.4 on Airthings’ own feedback page, with most early adopters recommending it for trend-spotting but cautioning against relying solely on the app’s averaged charts for health decisions.
For those who want an audible notification when radon spikes, the Airthings Wave Plus Voice Alert Performance: Can the Audible Alarm Wake You at Night? offers insights into whether the sound level is sufficient to get your attention during sleep. Many owners pair CSV analysis with voice alerts for a comprehensive monitoring approach.
Frequently Asked Questions
Can I Export Data From the Wave Plus Without an Internet Connection?
Yes, the mobile app can export data via Bluetooth even if the device is not connected to the Airthings cloud. Open the app near the device, tap the device page, and follow the export steps. Note that you can only export data that has been synced to the app previously, so if you have not opened the app for weeks, the local memory on the device itself (limited to about 30 days) will be the only source.
Why Does My CSV File Have Gaps in the Radon Data?
Gaps usually occur if the device was moved out of Bluetooth range during syncing, the battery died, or the sensor was offline. Check the timestamp column for missing periods. A battery change can cause a gap of a few minutes. If gaps are frequent, ensure your device is within 10 meters of the phone for Bluetooth syncing, or invest in an Airthings Hub for continuous cloud backup.
How Do I Convert Radon CSV Data From Bq/m³ to pCi/L?
To convert radon units, divide Bq/m³ by 37. For example, 148 Bq/m³ equals 4 pCi/L. Your spreadsheet can handle this easily: create a new column with formula = (Radon_cell/37) and format it with two decimal places. This is helpful if you are comparing against EPA guidelines that use pCi/L.
Can I Use the CSV Data for Legal or Insurance Claims?
You can, but with caution. The Wave Plus is not a certified laboratory-grade device; it is a consumer monitor with an accuracy of ±20% for radon at moderate concentrations. For legal disputes or insurance claims, a professional radon test using a passive device or a calibration-verified active monitor is recommended. The CSV export should be used as supporting evidence, not as sole proof.
Does the Wave Plus CSV Include Data From Before I Purchased the Device?
No, the CSV only contains data recorded after you first set up the device. There is no stored history from the factory. If you have an older Wave Plus (first-generation), the CSV may only show data from the last 30 days unless you sync regularly. Second-generation Wave Plus devices have improved memory but still overwrite after about 60 days without cloud sync.
How Many CSV Exports Can I Do Per Day Without Affecting Battery Life?
Exporting the CSV via Bluetooth is a low-energy operation that pulls data from the phone, not the sensor. Each export uses about 1% of the phone’s battery and negligible power from the device. You can export dozens of times per day without issue. However, constant Bluetooth reconnections (e.g., every 10 minutes) will reduce the device’s two-year battery life by an estimated 10–15%. For everyday analysis, export once a week.